Financial Analytics Platform
How we helped a mid-size accounting firm cut time-to-insight by 60% with an AI-powered reporting engine and real-time anomaly detection.
Financial Services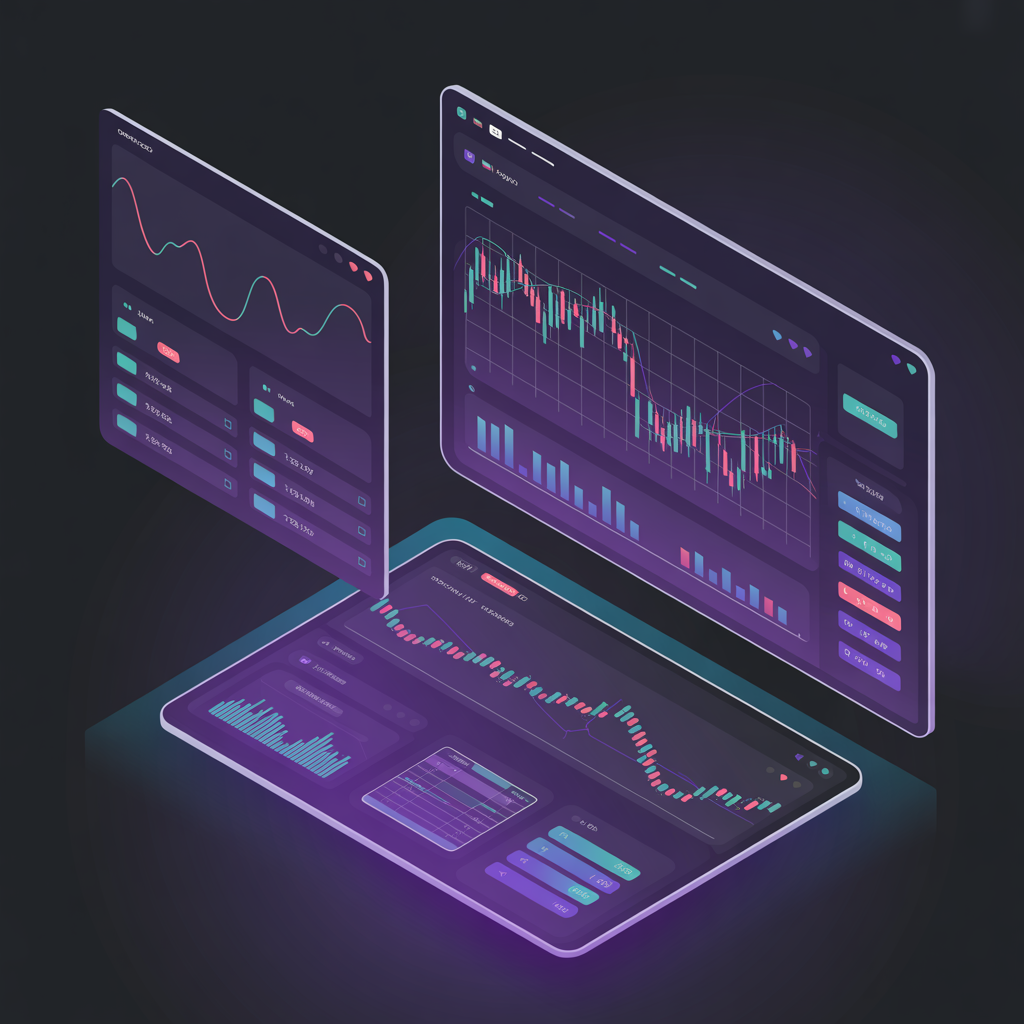
Manual reporting was consuming their best people
Our client, a mid-size accounting firm managing over two hundred client portfolios across the Midwest, was trapped in a cycle of manual data consolidation. Each month-end close required senior analysts to pull figures from six different source systems, reconcile discrepancies by hand, and assemble investor-ready reports in spreadsheets. The process consumed roughly three hundred person-hours per cycle, with error rates climbing as the client base grew.
Beyond the direct labor cost, the firm was losing competitive ground. Clients increasingly expected on-demand access to portfolio insights, not static PDFs delivered days after month-end. The leadership team recognized they needed a fundamentally different approach to financial data analysis and reporting, but lacked the internal technical expertise to build one.
They approached Solution Tech Consulting with a clear mandate: eliminate the manual bottleneck, deliver real-time visibility into portfolio performance, and free their analysts to focus on advisory work rather than data wrangling.
A three-phase build grounded in their existing ecosystem
Data Pipeline Architecture
We started with a two-week discovery sprint, mapping every data source, transformation rule, and output format the firm used. From that audit, we designed a real-time data pipeline built in Python that ingests transactional feeds from their accounting software, custodial platforms, and market data providers. The pipeline normalizes disparate formats into a unified data model, running automated reconciliation checks at every stage.
- Unified data model across six source systems
- Automated reconciliation with exception flagging
- Sub-minute data freshness for all portfolio views
AI Anomaly Detection
We trained custom anomaly detection models on eighteen months of historical transaction data. The models flag unusual patterns in cash flows, fee calculations, and position changes, surfacing potential issues before they reach a client statement. The system reduced post-close corrections by over eighty percent.
Interactive Dashboard Layer
The final phase delivered a dashboard application powered by custom APIs that serve pre-computed analytics to a responsive front-end. Analysts can filter by client, asset class, time period, or risk metric. Portfolio summaries that once took hours to compile are now generated in seconds with a single click.
Measurable impact from day one
Monthly close reporting that previously took five days now completes in under two days, freeing analysts for higher-value advisory work.
On-demand portfolio summaries generated in seconds rather than hours, enabling real-time client conversations.
AI-powered anomaly detection catches errors before they reach client statements, dramatically reducing correction cycles.
Built with proven, maintainable technology
The platform was engineered with long-term maintainability as a core requirement. The data pipeline runs on Python with Apache Airflow for orchestration, enabling the firm's IT team to monitor, schedule, and modify workflows without specialized expertise. Data transformations follow a modular architecture where each source system has its own adapter, making it straightforward to add new integrations as the firm's technology stack evolves.
The anomaly detection layer uses a combination of statistical models and lightweight machine learning classifiers trained on the firm's own historical data. We deliberately avoided heavy deep learning approaches in favor of interpretable models that analysts can understand and trust. Every flagged anomaly comes with a plain-language explanation of why it was flagged and a confidence score.
The dashboard consumes data through a RESTful API layer that serves pre-aggregated metrics, ensuring sub-second load times even when filtering across the full portfolio universe. The front-end is responsive and works seamlessly on both desktop workstations and tablets, allowing partners to present live data during client meetings.
Beyond the numbers: a transformed practice
The quantitative results tell part of the story, but the deeper impact has been organizational. Senior analysts who previously spent the majority of their time on data consolidation now dedicate that time to client advisory, competitive analysis, and proactive portfolio recommendations. The firm reported a measurable uptick in client satisfaction scores within two quarters of deployment, with several clients citing the real-time dashboards as a key differentiator when renewing their engagements.
The platform also changed the firm's hiring calculus. Instead of adding staff to keep up with portfolio growth, they have been able to scale their client base by thirty percent without increasing headcount on the reporting side. That operational leverage has directly improved margins and funded investment in new service lines.
"We went from dreading month-end to looking forward to it. The platform has not only saved us hundreds of hours, it has changed how our clients perceive us. We are no longer just their accountants; we are their strategic advisors with data to back every recommendation."
— Managing Partner, Financial Services Client
Explore our AI Automation capabilities
This project was delivered through our AI Automation Consulting practice. We design and deploy custom AI pipelines tailored to your operations, from document processing and data analysis to predictive modeling and intelligent alerting.
← View all case studiesReady to transform your data into decisions?
Tell us about your reporting challenges. We will show you what a modern analytics platform could look like for your organization in a free 30-minute strategy call.
Get Started